5.14.Program Profiling
\(5.14.\)Program Profiling
Unix systems provide the profiling program gprof.
- The program must be compiled and linked for profiling. We use
optimization flag
-0gto guaranteeing that function calls will be tracked properly:
1 | linux> gcc -Og -pg prog.c -o prog |
- The program is then executed as usual:
1 | linux> ./prog file.txt |
- gprof is invoked to analyze the data in
gmon.out:
1 | linux> gprof prog |
The first part of the profile report lists the times spent executing the different functions, sorted in descending order:
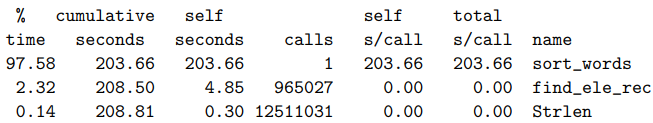
The first column indicates the percentage of the overall time spent on the function.
The second shows the cumulative time spent by the functions up to and including the one on this row.
The third shows the time spent on this particular function, and the fourth shows how many times it was called (not counting recursive calls).
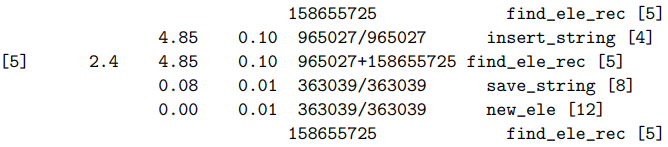
The second part of the profile report shows the calling history of
the functions. The following is the history for a recursive function
find_ele_rec:
We can use the gprof to focus our optimization efforts on the parts that consume the most time.